this post was submitted on 25 Oct 2023
1 points (100.0% liked)
Headphones
20 readers
2 users here now
A community for discussion around all topics related to headphones and personal audio.
founded 2 years ago
MODERATORS
you are viewing a single comment's thread
view the rest of the comments
view the rest of the comments

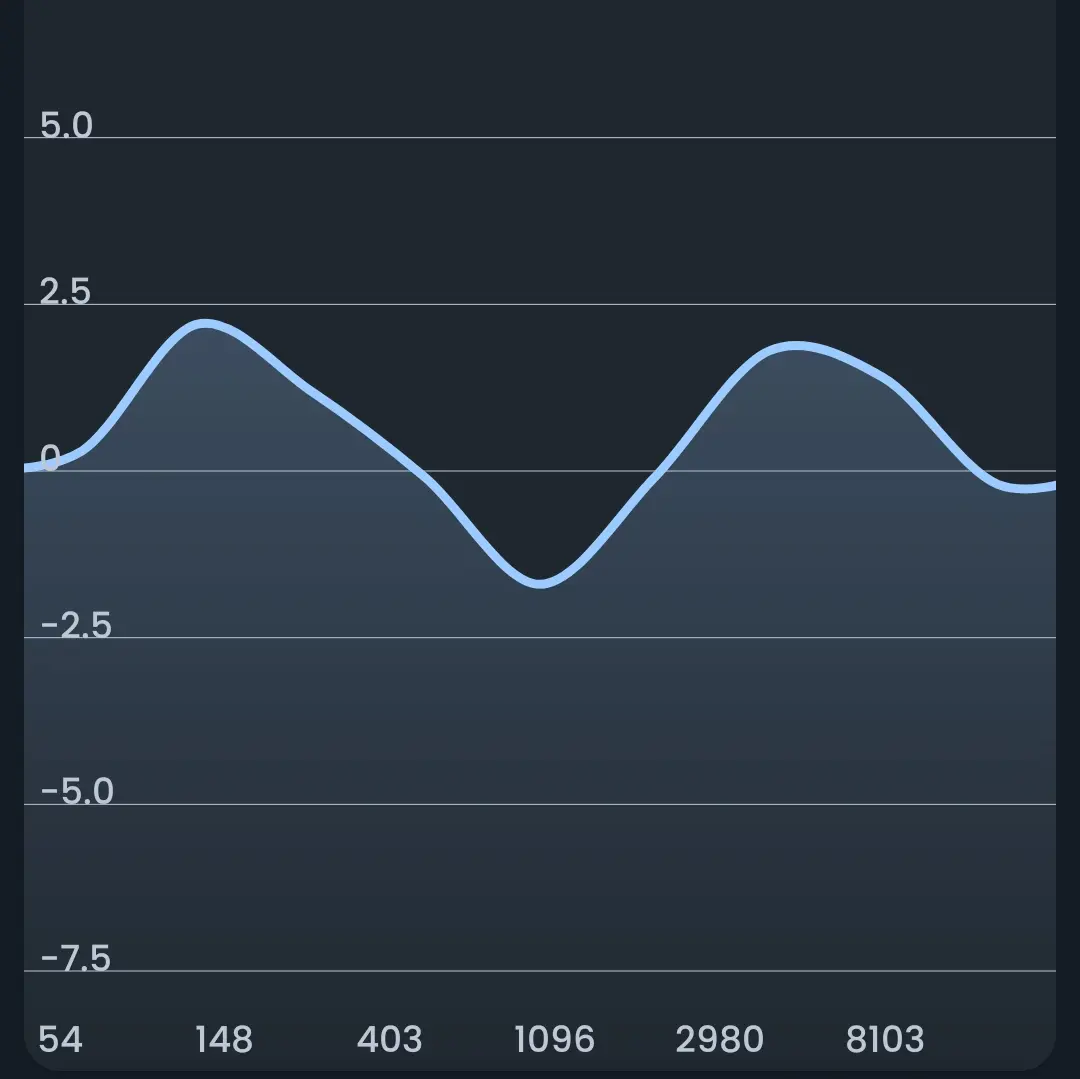
Actually you haven't adjusted things that much since your adjustments are within a plus to minus 2.5 dB range. Everyone's ear canals are different. Ear canals have different shapes, overall volumes, and different angles. You have simply used EQ in order to tweak the Wan'er sound signature in order to suit your personal preferences and your particular ears. At the end of the day, the only thing that truly matters are that these EQ tweaks sound good to you.
Interestingly, your EQ dip at right around 2 kHz is the exact region which I disliked about the Wan'er since I found this region to be a bit too bright for me. All IEMs have to simulate the ear pinna gain. Simulating the ear pinna gain starts at 1 kHz and has a rise above this region which eventually reaches a peak. If the rise above 1 kHz is too quick (as is the case with the Wan'er) then the simulated pinna gain will sound annoyingly bright. If the rise is a bit too slow, then this results in a very relaxing sound which perhaps is a bit lacking in details, yet is an IEM which you can listen to for long periods of time without developing listening fatigue. The Hola is an example of an IEM which avoids listening fatigue which can be listened to for hours on end, yet is a bit lacking in details.
In a nutshell, you simply "fixed" the Wan'er to best suit your preferences in terms of removing the listening fatigue issue, and adding a bit of bass and treble to make these IEMs float your boat.
I assume that you have been looking at lots of frequency response graphs on squiglink. IEMs measure a bit wacky above 8 kHz since this is past the resonance frequency of most of the microphone couplers which are used to measure IEM frequency response. The people who measure and post graphs on squiglink don't have thousands of dollars to spend on the ultimate in professional measuring equipment. In other words, take all measurements above 8 kHz with a huge grain of salt in terms of accuracy in the measurements, yet these measurements can indicate a general overall trend as to whether or not any headphone or IEM either has some air above 8 kHz or completely lacks any air above 8 kHz.
And for some final food for thought, frequency response graphs merely measure the peaks of the sine waves at any point in the frequency response graph. The frequency response graphs do not capture anything about how clean or distorted the sine waves actually are. A super perfect sine wave has less inherent energy when measured from from peak to peak than a distorted sine wave when measured from peak to peak. The microphone in the measurement coupler is only measuring the peaks of the sine waves. Yet your ear can easily perceive differences in the total energy which is contained in a pure sine wave versus a distorted sine wave. This, for example, is why planar IEM graphs might indicate that the bass response should have the same perceived intensity as the bass response from a dynamic driver which measures the same, yet the intensity which you actually hear usually will be quite different.
I hope that I did not overload you with too much information. On the other hand, I hope that I offered some fun stuff to think about.