this post was submitted on 23 May 2026
29 points (93.9% liked)

Climate

8669 readers
295 users here now

Discussion of climate, how it is changing, activism around that, the politics, and the energy systems change we need in order to stabilize things.

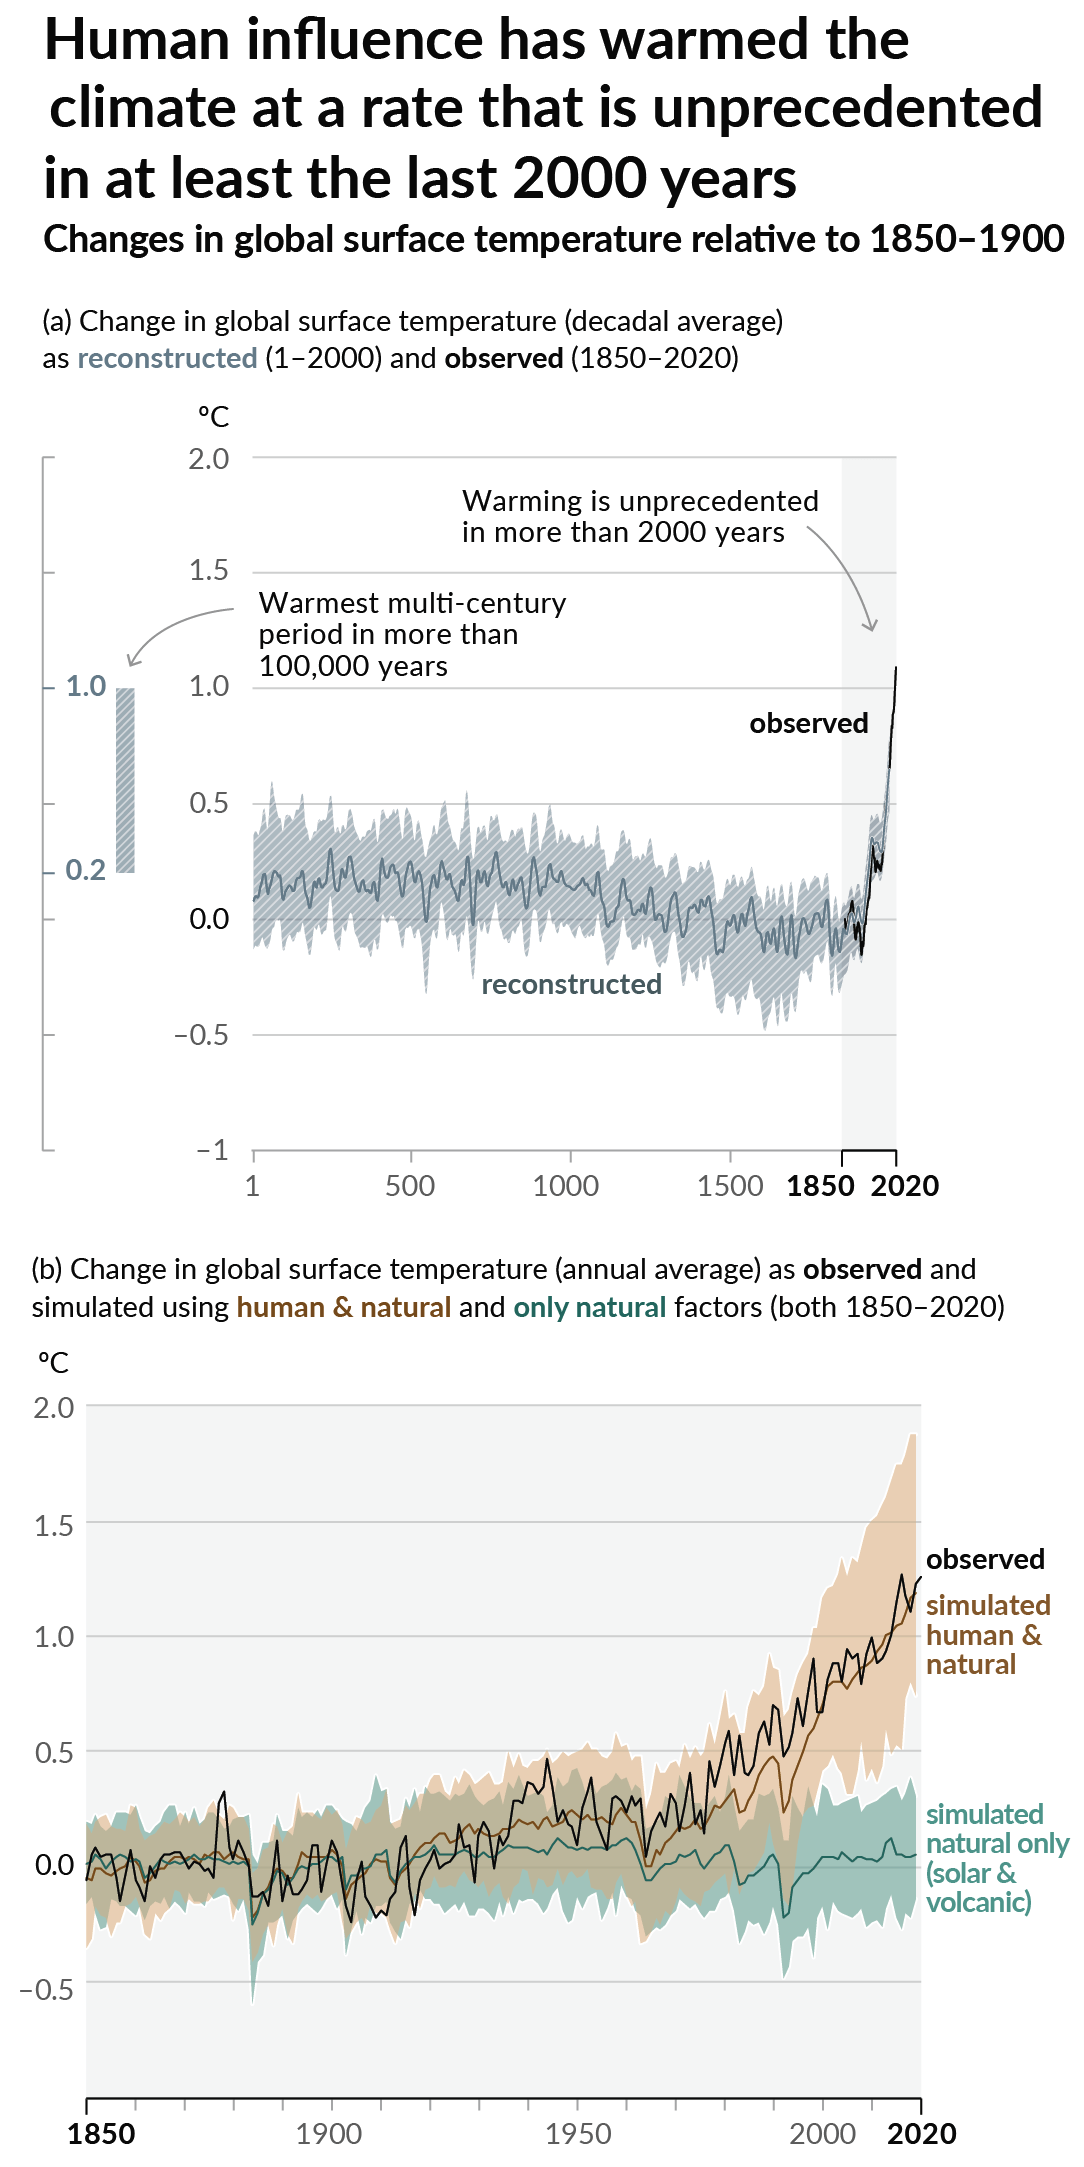
As a starting point, the burning of fossil fuels, and to a lesser extent deforestation and release of methane are responsible for the warming in recent decades: Graph of temperature as observed with significant warming, and simulated without added greenhouse gases and other anthropogentic changes, which shows no significant warming

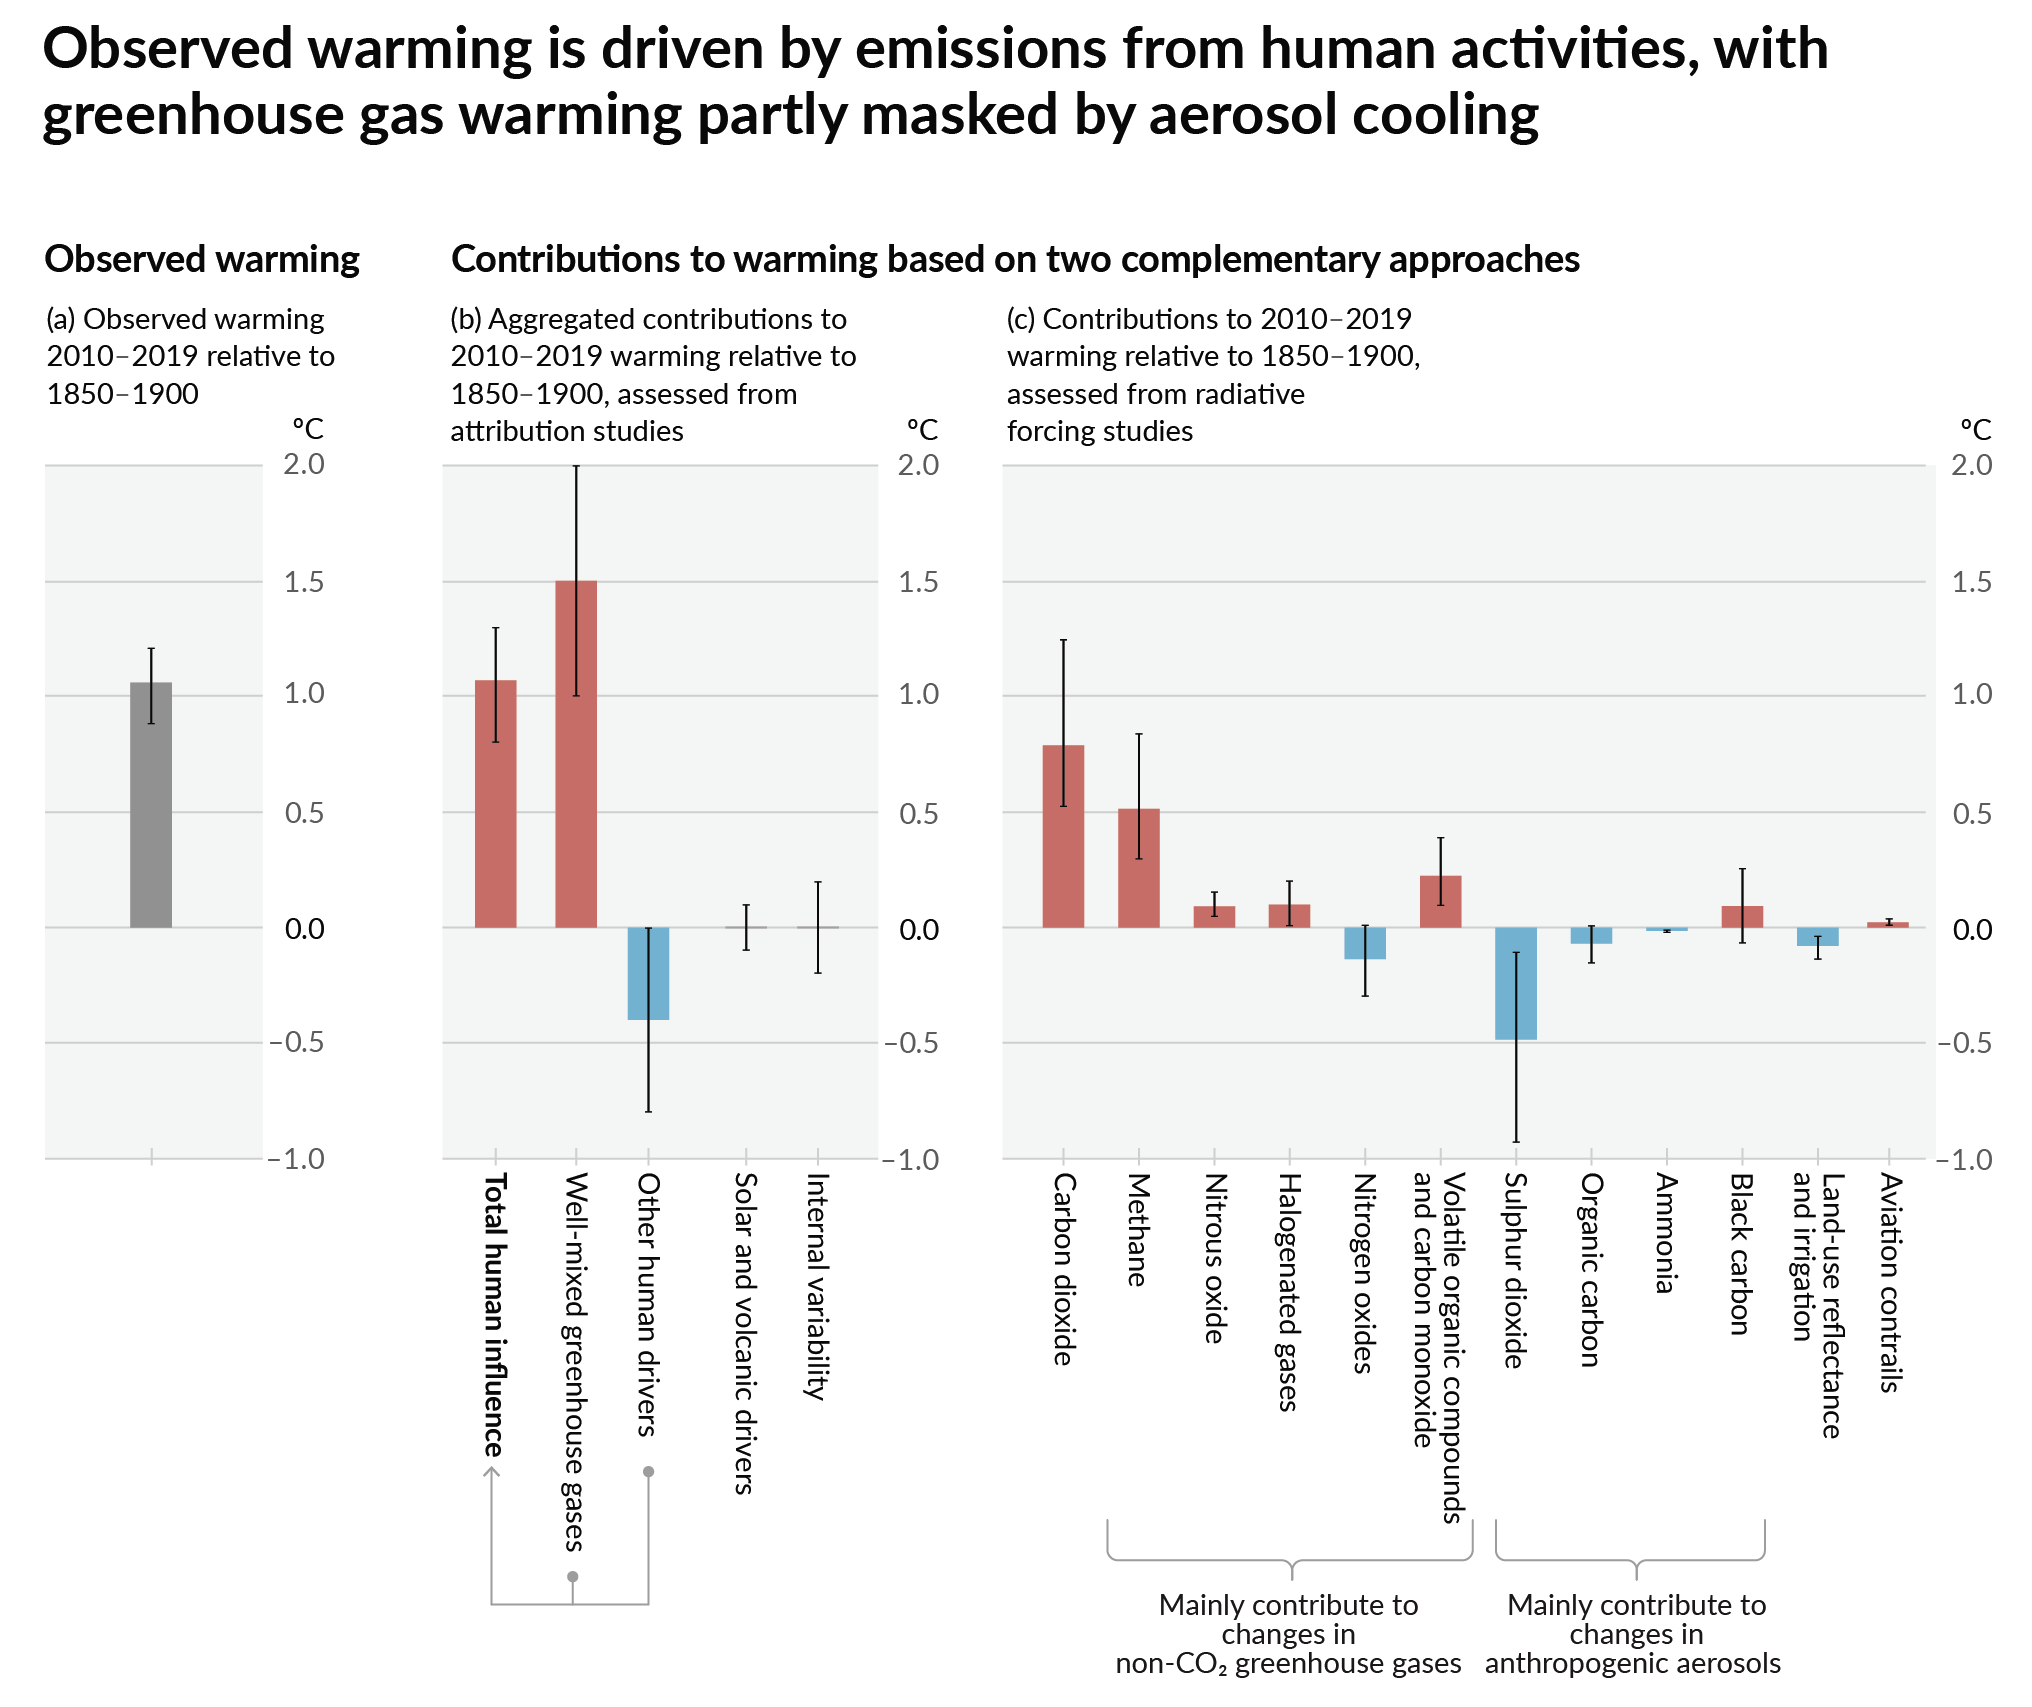
How much each change to the atmosphere has warmed the world: IPCC AR6 Figure 2 - Thee bar charts: first chart: how much each gas has warmed the world.  About 1C of total warming.  Second chart:  about 1.5C of total warming from well-mixed greenhouse gases, offset by 0.4C of cooling from aerosols and negligible influence from changes to solar output, volcanoes, and internal variability.  Third chart: about 1.25C of warming from CO2, 0.5C from methane, and a bunch more in small quantities from other gases.  About 0.5C of cooling with large error bars from SO2.

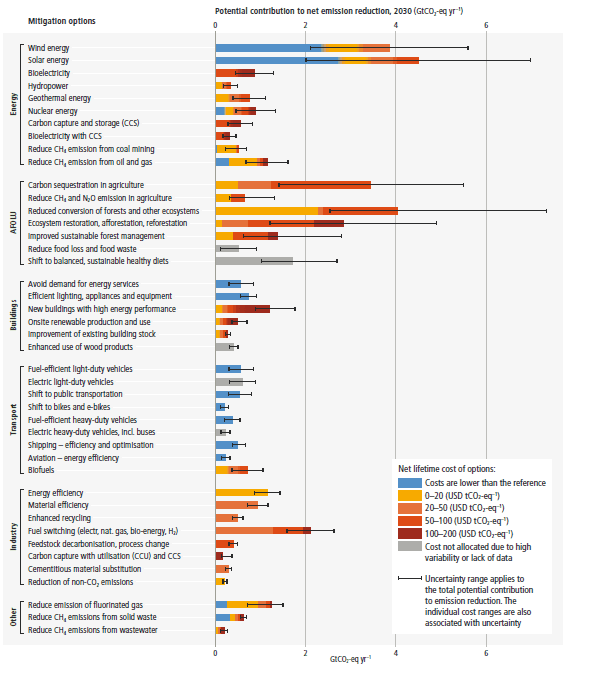
Recommended actions to cut greenhouse gas emissions in the near future:

Anti-science, inactivism, and unsupported conspiracy theories are not ok here.

founded 3 years ago
MODERATORS
top 10 comments
sorted by: hot top controversial new old
[–] Doc_Crankenstein@slrpnk.net 3 points 3 days ago

The saddest part is that a good chunk of what is produced from that livestock gets thrown away because overproduction doesn't matter under capitalism so long as profits exceed costs of production.

Entire farms worth of animals being slaughtered, with those in power who demand it be done knowing full well that nearly half is going to end up in a landfill, because it has the potential to make the owners a buck of profit.

How others are not enraged by this, I do not know. It fills my blood with a cold anger.

[–] Tiresia@slrpnk.net 1 points 2 days ago

It seems odd to me that crops for feed would be less than crops, considering this source says 80% of agricultural land is used for feed. Some of that land is for grazing, sure, but it smells fishy.

The percentages seem to be lifted from supplementary table S17 from Poore & Nemecek (2018), which isn't paywalled (the main article is, but sci-hub gets around that). This table cites EDGAR 4.2 FT2010, a dataset compiled for the European Commission, but the link redirects to the EDGAR landing page.

The Internet Archive version of the page shows links to downloadable tables, which aren't archived and which 404 on the EDGAR website. None of which would obviously provide a global CO2 equivalent of all greenhouse gases by industry component. The page also says there is a detailed explanation in a report to the International Energy Agency, which is archived but which makes no mention of "feed".

Trying to find the same data through EDGAR's archive, I come to this page, but it appears to be raw data which doesn't split things up into different sectors, but which does somehow purport to track CO2 emissions per square of 0.1 degrees latitude and longitude excluding CO2 from "short-cycle biofuels" (e.g. firewood).

This makes very little sense to me as raw data. I could see a satellite-bassd determination of CO2 emissions, but that wouldn't exclude firewood. I could see this being the output of land use analysis and modeling, but then where is the model? Where are the inputs of the model? Where is the citation of the scientific article explaining the model?

Also, the data only seems to go up to 2008 when Poore and Nemecek cite it for a 2010 average. So I have no idea what the heck is going on.

[–] pageflight@piefed.social 2 points 3 days ago (2 children)

Have you seen a chart like this for all sources, not just food?

[–] Greyghoster@aussie.zone 5 points 3 days ago

From what I’ve seen, it highlights that the most pressing change with the least resistance is to get off coal and oil as quickly as possible. Agriculture requires too many people to change for it to happen quickly which is why the fossil fuel lobby love to use it as a red herring.

[–] HubertManne@piefed.social 1 points 3 days ago (1 children)

wish this was a link to the site. I assume you could go through years and how its changed and such.

[–] Innerworld@lemmy.world 3 points 3 days ago (1 children)
[–] HubertManne@piefed.social 2 points 3 days ago (2 children)

Thanks. A little dispointed its not sliders and such but like that there is more. Little surprised cheese is higher than pork and chicken.

[–] Grail@multiverse.soulism.net 2 points 3 days ago

Here's why America makes way too much cheese: https://youtu.be/NQiLly6Z1xs

[–] Madzielle@lemmy.dbzer0.com 2 points 3 days ago

cows eat a lot