NFL

114 readers
6 users here now

A place for NFL news, game highlights and everything that excites you about American Football.

founded 2 years ago
MODERATORS
2001
2002


Rank Team Adj. Win %
1 Kansas City .763
2 Philadelphia .760
3 Baltimore .730
4 Jacksonville .707
5 Cleveland .690
6 Pittsburgh .690
7 Detroit .673
8 San Francisco .660
9 Miami .594
10 Houston .573
11 Dallas .564
12 Seattle .547
13 NY Jets .537
14 Atlanta .536
15 Buffalo .534
16 Indianapolis .533
17 Tampa Bay .513
18 Cincinnati .510
19 LA Rams .491
20 Minnesota .448
21 Tennessee .405
22 LA Chargers .394
23 New Orleans .393
24 Washington .388
25 Las Vegas .379
26 New England .362
27 NY Giants .334
28 Green Bay .323
29 Denver .309
30 Chicago .292
31 Arizona .221
32 Carolina .149

I'm using the Colley Matrix iteration process (https://www.colleyrankings.com/method.html)

To summarize, you take the win percentage of every team and correct it against the win percentage of their opponents. Then you have a new win percentage. And I repeat that process until the correction factor is below 0.01%. Essential this is what I would expect the win percentages to be if the teams played an average team every week.

2003
 
 
2004


On this post from a couple of years ago most people in the comments were saying Sean Payton will eventually go into the HOF…did he ruin his legacy by going to Denver?

https://reddit.com/r/nfl/s/uACrUEI8Dq

2005
2006
2007
2008


In 2016, Christian McCaffrey set the single season record for receptions by a running back with 116 catches.

Alvin Kamara has 35 receptions through 4 games this year (8.75 receptions per game). If he were to maintain his current pace for the Saints' remaining 10 games, he'd finish with 123 catches.

2009
2010


There was a post yesterday about Zach having a better 4th quarter passer rating than Brock Purdy and I noticed in the linked pro-football-reference stats page that his 4th down passer rating split was shockingly high, so I decided to see where it ranked all-time (min 25 attempts). Once he figures it out on the other three downs its over for the rest of you hoes

All-Time Rank Player 4th Down Passer Rating
1 Patrick Mahomes 128.2
2 Scott Mitchell 125.0
3 Andy Dalton 122.2
4 Peyton Manning 121.9
5 Justin Herbert 120.0
6 Rich Gannon 119.7
7 Jalen Hurts 119.7
8 Joe Burrow 115.9
9 Mark Brunell 114.7
10 Zach Wilson 114.3

Active Player Rank Player 4th Down Passer Rating
1 Patrick Mahomes 128.2
2 Andy Dalton 122.2
3 Justin Herbert 120.0
4 Jalen Hurts 119.7
5 Joe Burrow 115.9
6 Zach Wilson 114.3
7 Derek Carr 109.3
8 Jacoby Brissett 105.5
9 Trevor Lawrence 104.8
10 Jimmy Garoppolo 103.2

2011


Football is generally known as the league with the most ~~parody~~ parity because of the draft+salary cap (though we've seen this can be offset with franchise QBs), while baseball with a looser salary cap and a less consequential draft makes it more like European soccer.

However this year's world series is featuring two teams who were among the league's worst just two years prior.

What's the closest NFL equivalent?

2012
2013


2023 ANY/A Leaders

Rank Player ANY/A Cmp Att Cmp% Yds TD TD% Int Int% Y/G Rate QBR
1 Tagovailoa 8.70 163 229 71.2 2092 15 6.6 6 2.6 298.9 110.4 69.3
2 Purdy 8.20 131 193 67.9 1668 11 5.7 3 1.6 238.3 107.2 75.6
3 Stroud 7.43 127 213 59.6 1660 9 4.2 1 0.5 276.7 96.4 57
4 Mahomes 7.32 185 266 69.5 2017 15 5.6 6 2.3 288.1 101 76.9
5 Jackson 7.17 142 200 71 1610 8 4 3 1.5 230 101.9 63.3
6 Cousins 6.97 193 280 68.9 2057 16 5.7 5 1.8 293.9 101.7 60.5
7 Allen 6.96 174 246 70.7 1841 15 6.1 7 2.8 263 100.7 74.8
8 Goff 6.83 174 256 68 1902 11 4.3 4 1.6 271.7 97.5 67.7
9 Herbert 6.54 142 212 67 1592 10 4.7 4 1.9 265.3 97.1 65.2
10 Wilson 6.31 142 214 66.4 1499 13 6.1 4 1.9 214.1 99 46.1

Link

All-Time ANY/A Leaders with Adjusted Stats

Rank Player ANY/A Year Team ANY/A+ GS QBrec Att Y/A+ NY/A+ AY/A+ ANY/A+ Cmp%+ TD%+ Int%+ Sack%+ Rate+
1 Manning 9.78 2004 IND 153 16 12-4 497 141 147 149 153 127 168 120 128 151
2 Rodgers 9.39 2011 GNB 147 15 14-1 502 144 139 150 147 127 153 127 96 149
3 Foles 9.18 2013 PHI 143 10 8-2 317 147 135 151 143 109 147 135 86 142
4 Ryan 9.03 2016 ATL 141 16 11-5 534 148 142 145 141 128 133 119 97 140
5 Marino 8.94 1984 MIA 150 16 14-2 564 140 153 141 150 127 148 115 135 141
6 Mahomes 8.89 2018 KAN 136 16 12-4 580 131 134 134 136 109 144 105 118 131
6 Rodgers 8.89 2020 GNB 135 16 13-3 526 120 124 134 135 127 146 126 121 140
8 Brady 8.88 2007 NWE 142 16 16-0 578 130 132 142 142 129 153 126 117 148
9 Manning 8.87 2013 DEN 139 16 13-3 659 128 135 134 139 125 145 120 130 137
10 Brady 8.81 2016 NWE 138 12 11-1 432 125 131 133 138 119 125 134 123 133
11 Tagovailoa 8.70 2023 MIA 137 7 5-2 229 144 145 136 137 129 129 94 117 135

Link

Adjusted stats are corrected for each individual season, such that 100 in any category represents the league average for that year.

Year-by-Year Adjusted ANY/A Leaders since 2000

Year Player ANY/A+ Team
2023 Tua Tagovailoa (25) 136 MIA
2022 Tua Tagovailoa (24) 138 MIA
2021 Joe Burrow (24) 126 CIN
2020 Aaron Rodgers (36) 134 GNB
2019 Ryan Tannehill (31) 140 TEN
2018 Patrick Mahomes (22) 134 KAN
2017 Alex Smith (33) 121 KAN
2016 Matt Ryan (31) 145 ATL
2015 Carson Palmer (35) 131 ARI
2014 Aaron Rodgers (30) 135 GNB
2013 Nick Foles (24) 151 PHI
2012 Robert Griffin III (22) 123 WAS
2012 Aaron Rodgers (28) 123 GNB
2011 Aaron Rodgers (27) 150 GNB
2010 Tom Brady (33) 127 NWE
2009 Philip Rivers (27) 131 SDG
2008 Philip Rivers (26) 129 SDG
2007 Tom Brady (30) 142 NWE
2006 Donovan McNabb (29) 132 PHI
2005 Ben Roethlisberger (23) 128 PIT
2004 Peyton Manning (28) 149 IND
2003 Steve McNair (30) 129 TEN
2002 Chad Pennington (26) 134 NYJ
2001 Kurt Warner (30) 132 STL
2000 Trent Green (30) 139 STL

Link

2014
2015


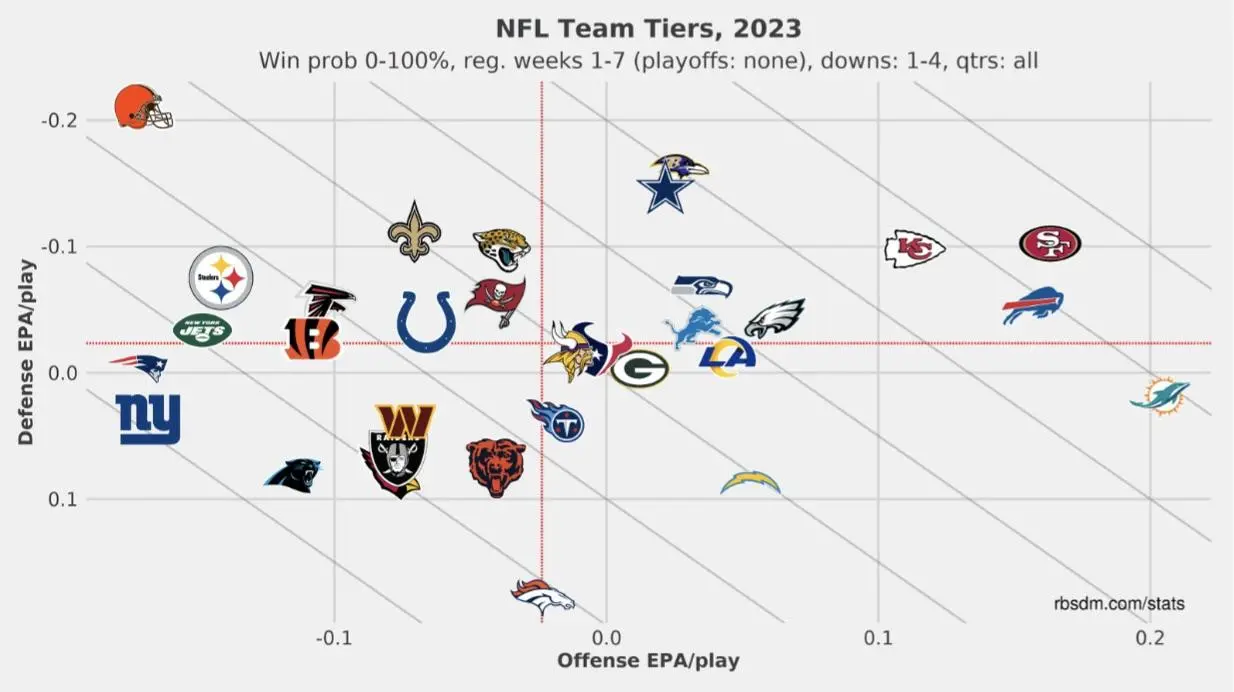
For people asking, EPA/play means Expected Points Added per play. For example, with current data, the Dolphins are expected to earn 1 point for every 5 offensive plays they run; teams playing against the Browns are expected to lose a point for every 5 plays against their defense.

2016
2017
2018
2019


Who has been a standout on your team but has gone under the radar of the national media and most fans?

2020


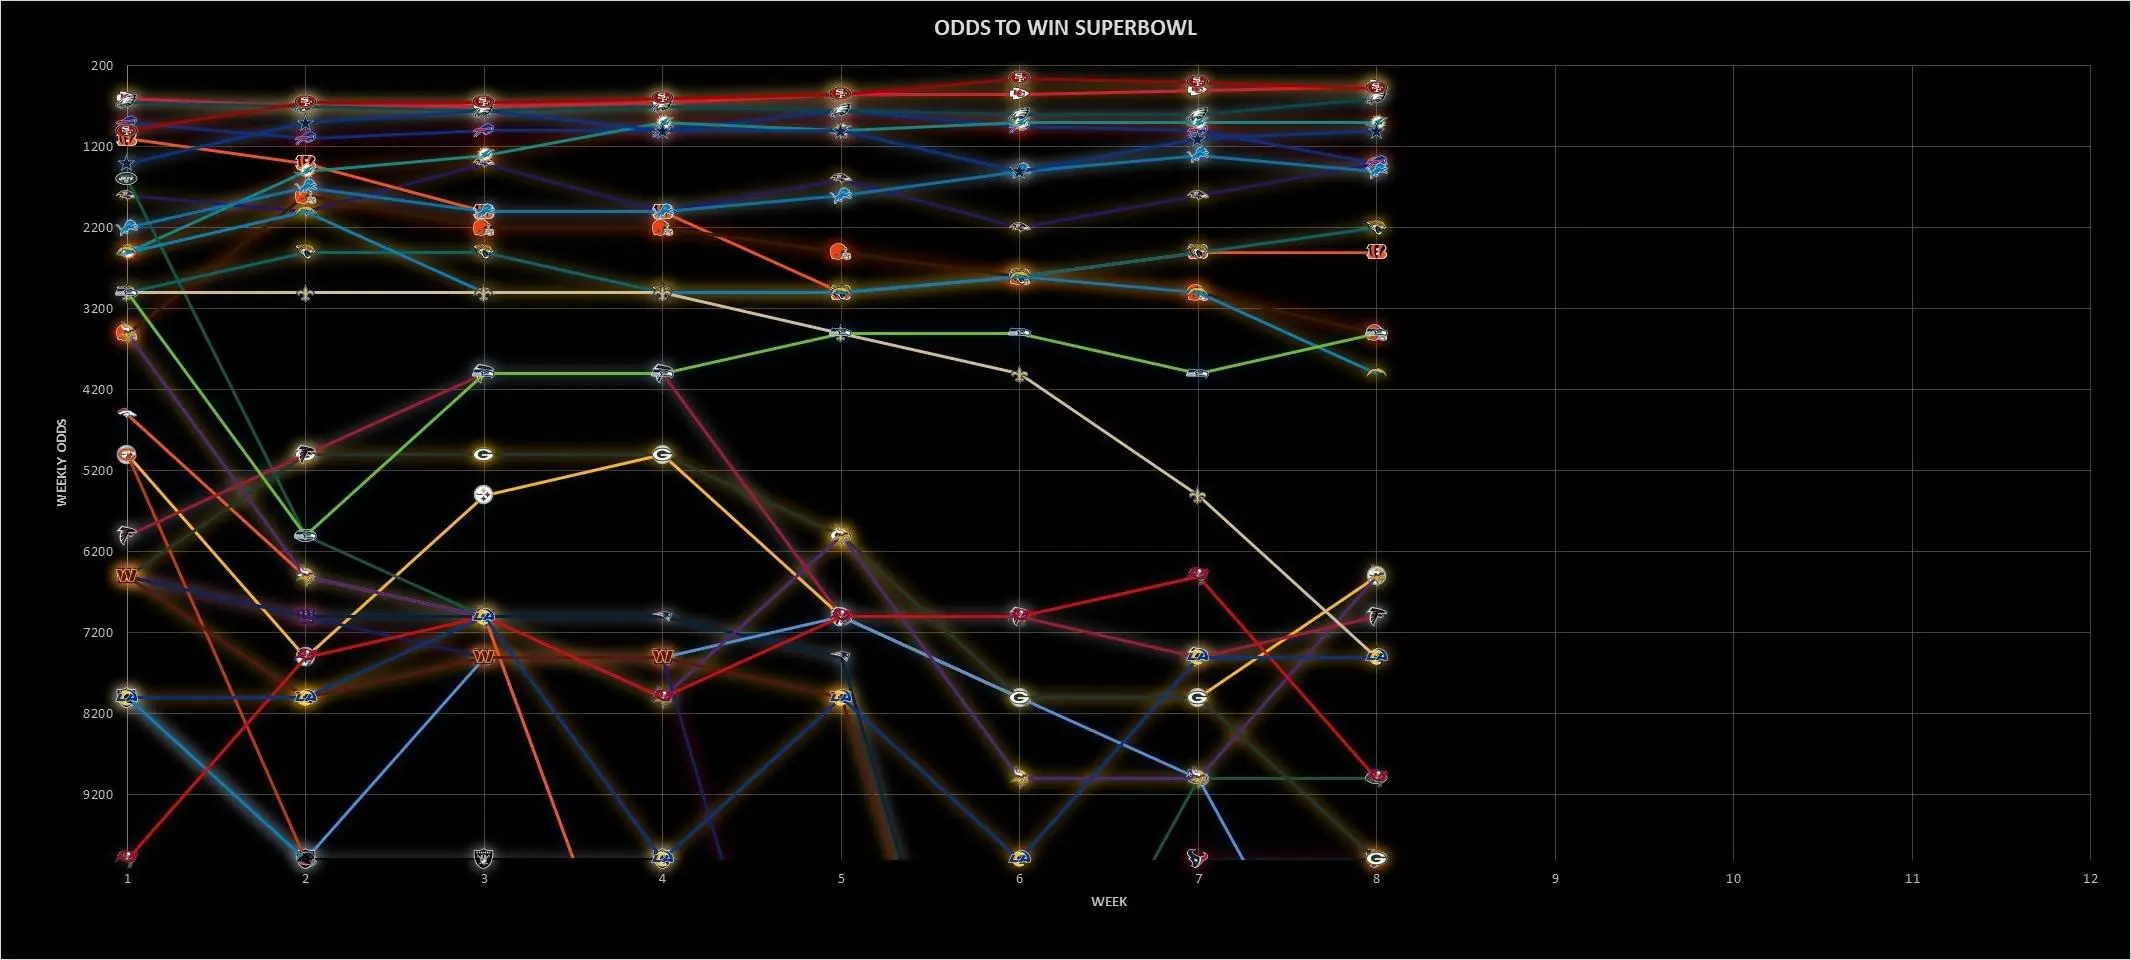
I pull all the odds from Draftkings before each week kicks off. Unfortunately I had to cut the chart off at +10,000 because otherwise it gets too messy, so the bottom teams drop off. If I made it a log scale instead, everything would fit but you wouldn’t see the gap between the good teams and bad teams. Any advise on how to improve this is appreciated. Thanks guys!

Biggest Risers:

Vikings : ⬆️27.78%

Eagles: ⬆️25.00%

Ravens : ⬆️22.22%

Steelers: ⬆️18.75%

Seahawks: ⬆️12.50%

Biggest Fallers:

Commanders: ⬇️-92.31%

Raiders: ⬇️-53.85%

Titans: ⬇️-44.44%

Bills: ⬇️-40.00%

Buccaneers: ⬇️-38.46%

Saints: ⬇️-36.36%

Chargers: ⬇️-33.33%

2021


Game situation: 2:26 left in 4Q, Vikings up 5 and trying to run as much clock as possible. 3rd and 3 at SF 49:

(2:26) (Shotgun) K.Cousins pass short right to J.Addison to SF 36 for 13 yards (T.Hufanga). Penalty on SF-I.Oliver, Defensive Holding, declined.

The Vikings convert and decline the penalty. Without the penalty, the clock would have ran all the way to the 2-minute warning. Instead, the clock was stopped and the Vikings were forced to run another play, thereby giving the 49ers a free timeout:

(2:19) C.Akers left end to SF 4 0 for -4 yards (F.Warner, T.Gipson).

This rule comes from Section 3 article 2 part (e) of the NFL rulebook:

If the game clock is stopped after a down in which there was a foul by either team, following enforcement or declination of a penalty, the game clock will start as if the foul had not occurred, except that the clock will start on the snap if:

the foul occurs after the two-minute warning of the first half;

the foul occurs inside the last five minutes of the second half; or

the offense commits a foul after the ball is made ready for play, and causes the clock to stop before a snap, during the fourth quarter or overtime; or

a specific rule prescribes otherwise.

Since this defensive foul occurred in the last 5 minutes, the clock remains stopped until the next snap. Is this an unfair advantage to give teams to stop the clock? Could a team intentionally commit an offsides penalty to get an extra timeout?

2022
2023
2024
 
 
2025
view more: ‹ prev next ›